How to Read Candlestick Charts
If you are learning about the stock market, you may have come across the word candlestick charts and been confused. These are a widespread aid used by experts for finding shares for day trading. They are visual tools that show price movements, a feature traders need to make better decisions.
These are game-changers for traders who know how to read them. However, this is the issue as many traders are beginners and don't know how to read candlestick charts!
If you are in this category, don't worry, as this blog covers the basics of how to understand candlestick charts, their patterns, and decision-making based on them.
Candlestick Graphs or Charts: What Are They?
These are simply charts used in trading and finance to see the price changes of a share, commodity, or currency. Candlestick chart patterns for intraday trading are essential for making profitable trades.
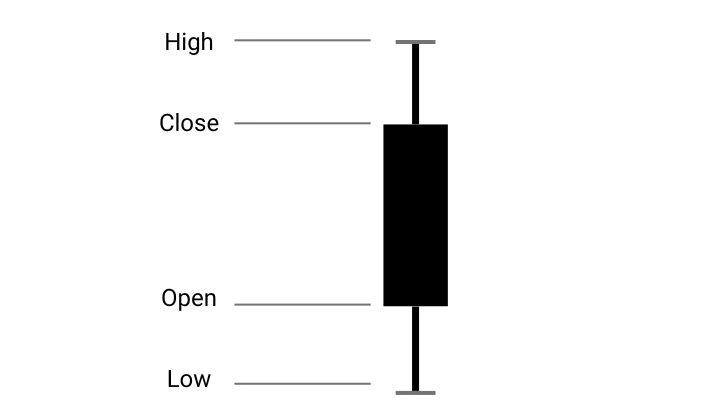
Any skilled trader would tell you each bar is coloured red or green and is called a "candle", which shows information on one of four vital areas:
- • High position: It will show the maximum price achieved and is represented by a narrow line (candle wick) from the top of the "candle."
- • Low position: It can show the lowest price achieved and is represented by a narrow line (candle wick) from the bottom of the "candle."
- • Open: This is the first price at which an asset trades during the start of a period.
- • Close: This is the last price at which an asset trades during the start of a period.

Candlestick Anatomy
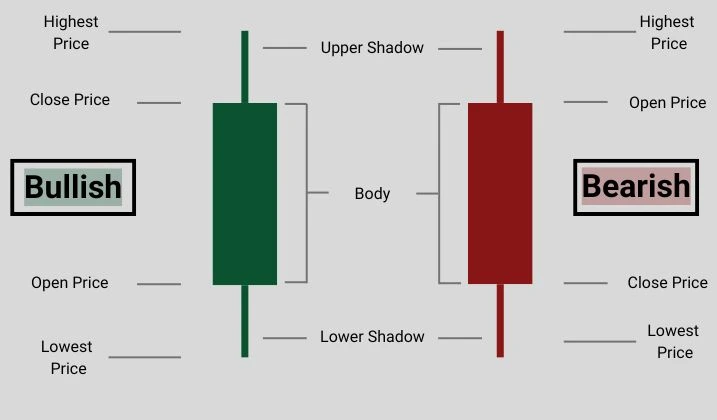
All chart candlesticks have two core portions, a body and a shadow, which can be further classified. You can learn about candlestick anatomy to be able to read them properly. If you aren’t sure where to learn more about them, look at a stock market course.
To know how to analyse candlestick charts, you must know the parts of a candlestick and what they mean.
- 1. Body
- • Bullish: The bars here are green or white and appear if the end price is above the opening one.
- • Bearish: These appear in a red or black shade and tell you when the final closing price is more than the opening price.
- 2. Shadows/Wicks
- • Upper Shadow: This narrow "wick" or line comes from the top of the bar.
- • Lower Shadow: This thin "wick" comes out of the bottom of the bar.
This part appears as an upright rectangle, and its ends represent the opening and closing prices.
Anyone who studies shadows will see two types of shadows in candles, an upper and a lower shadow.,
You'll find that studying the candlestick itself simplifies candlestick chart reading.

How to Analyse Candlestick Charts
The body of these candle bars shows the opening and closing share costs throughout a period. It gives a trader insight into the price over time. Knowing the basics of candlestick charts, like the colour of the bars, will grant you vital information.
- • The thin protruding lines from the candle clearly show the price highs and lows.
- • Red short wicks show the share has opened at an all-day high.
- • Green, short wicks show the share has closed at an all-day high.
Candlestick charts and patterns relate opening and closing prices and their highs and lows. The body's length and accompanying shadows tell you about the market sentiment toward a share.
Types of Candlestick Patterns
You can't become an expert on how to understand candlestick chart data until you know all the types of charts. Traders must note predominant patterns exist, and they are bullish and bearish candlestick patterns.
Let's learn about them from an individual view to understand them better.
Note from these types, there could be a double or single candlestick pattern. Let's start with the bullish ones.
Bullish Candlestick Patterns
These patterns show a possible upward trend and hike in share prices, indicating buyer strength rising.
- • Morning Star Candle Pattern
- • Three White Soldiers Pattern
- • Hammer Candlestick Pattern
Unlike the other two, this graph chart pattern has three candles where a single short-bodied candle stands between a long green and red candle.
Its name suggests it has three green short-wicked candles. Each candle opens and closes higher than the previous one, and when it appears after a downward trend, the three white soldiers pattern indicates an imminent bull trend.
This chart will display a lower wick that is longer than the body. It represents a strong buying intent despite selling pressures.
Bearish Candlestick Patterns
These patterns show a possible downward trend and a drop in share prices, indicating seller strength rising.
- • Shooting Star Candlestick Chart Patterns
- • Hanging Man Pattern
- • Evening Star Candlestick Pattern
It is the opposite of hanging man patterns and has a long wick compared to the short body. It shows the asset had a brief rally before dropping, much like a shooting star.
The name is derived from a short-bodied candle with a long lower wick at the top of an upward trend. It shows traders that the sellers had more momentum than the buyers.
Again, this is a three-candle pattern in which one candle is shorter and placed between a long red and green one without overlapping, showing a reversal of an upward trend.
A notable mention is the Doji candlestick pattern, which is bearish or bullish depending on the market situation.
As you can see, there are many candlestick chart patterns to learn about, and if you can't do it, you can get a stock market consultant to help you.
Candlestick Graph Patterns Every Indian Trader Should Know About
Apart from the bearish and bullish types, the chart patterns are separated based on the candles. You must know about them to learn how to read candles in stock market graphs.
- • Single Candlestick Patterns
- • Double Candlestick Pattern
- • Triple Candlestick Pattern
These are composed of a single bar, and the best examples of this graph are the Hammer, Shooting Star, and Doji patterns.
These are composed of two bars, and the examples of these graphs are the Bullish and Bearish engulfed patterns.
These three bared charts are visible in the Morning and Evening Star patterns.
Perks of Reading Candlestick Charts
Perfecting candlestick chart analysis is vital for traders as it helps understand the market sentiment and upcoming trends.
- • It helps market participants make quick decisions.
- • Studying candle patterns in stock market graphs helps predict a short-term price change, which results in intraday trading profit.
- • You can learn candlestick chart analysis to benefit your short and long-term investment plans.
Common Mistakes in Candlestick Analysis
Bullish and bearish candlestick patterns are helpful tools for traders, but they can still make mistakes when reading them.
- • Over-dependence on patterns and graphs: There is no denying the importance of candlestick charts for day trading, but avoid using them alone.
- • Not assessing the context properly: Traders must look at the broader context and market status before coming to a conclusion.
- • Ignoring the complete picture: Traders looking for an easy way to read candlestick charts may look at one bar's body and ignore the rest, leading to incomplete details.
These are a few mistakes a reliable trading mentor would warn you about, but there are others and having a partner can protect you from making them.

Conclusion
By learning about and how to read candlestick charts, you are setting yourself up for more accuracy and profits.
It is a valuable skill needed to become a successful full-time trader, as it helps you predict upward or downward trends and price changes and position yourself for maximum profits. We hope you won't still ask yourself how to read a candlestick graph after reading!
If you still lack the confidence to read these candlestick graphs, you can contact us for an expert to unlock your potential!
FAQs about Mutual Funds versus EFTs
-
How do candlestick charts differ from bar charts and line charts?
The former is more helpful, and if you understand candlestick patterns, you can determine the opening, closing, high, and low prices of a share. -
What is the three-candle rule?
The three-candle rule tells traders to not act on a pattern until they confirm status using three consecutive candlesticks. -
What do the colours of a candlestick represent?
By rule, green or white bars show a bullish trend, while red or black bars show a bearish trend is approaching. These colours, the candle, and the wick length give all the information needed. -
How can I identify bullish and bearish trends with candlestick patterns?
Since you know what patterns belong to the bullish and bearish trend groups, look at the stock chart candlestick patterns to spot the morning star (bearish) or shooting/evening star (bullish) patterns. -
What are some tips for interpreting candlestick patterns accurately?
Traders must get as much information as possible from the graphs, and this will require them to look at the complete chart, confirm the trends with other tools, and use multiple ways to find trends than relying on these charts.


